EXARC, the ICOM Affiliated Organisation representing archaeological open-air museums, experimental archaeology, ancient technology, and interpretation, migrated it’s bibliographic database into the EXARC Experimental Archaeology Data Collection in tDAR this month, with technical support from the Center for Digital Antiquity. Now, in addition to providing an extensive bibliography for those interested in experimental and experiential archaeology, primitive technology and archaeological open-air museums, EXARC will be able to make publications and supplementary data (images, fieldnotes, large datasets) available, where possible; and preserve the files for the long-term. It will also make the bibliographic citations available to a wider audience by including them with other archaeological resources.
The bibliography was originally compiled by EXARC Director, Dr Roeland Paardekooper. The new collection will be managed by Dr Jodi Reeves Eyre.
In the future, EXARC plans to extend the collection and work with with universities and museums to upload their experimental archaeology data, publications and grey literature into the collection. The long term goal is to establish a board of professionals to oversee the collection, evaluate the quality of submissions and promote the preservation of and access to the wealth of data produced. If you or your institution are interested in contributing materials, or you want to learn more about supporting the collection, please contact Reeves Eyre.
We’re excited to be travelling to Lincoln, Nebraska later this week for the 74th Annual Plains Anthropological Conference. We hope that you will stop by our booth in the exhibit hall to speak with a digital curation expert about your digital archaeological information, to enter our drawing for a chance to win a digital preservation package, or just to grab some tDAR swag and say hi! You can also see our poster “Curating and Preserving Digital Archaeological Data: A Guide to Good Practice” in Salon B/C between 2-4PM on Thursday, October 13th. If you are in the Lincoln area and want to learn more about tDAR, but won’t be attending the conference, please send an email to laellison@digitalantiquity.org to set up a time to meet. See you soon!
Did you know that if you have digital resources in tDAR you can find out how many people have viewed or downloaded your files?
Here’s how to see your usage stats:
Log in to tdar
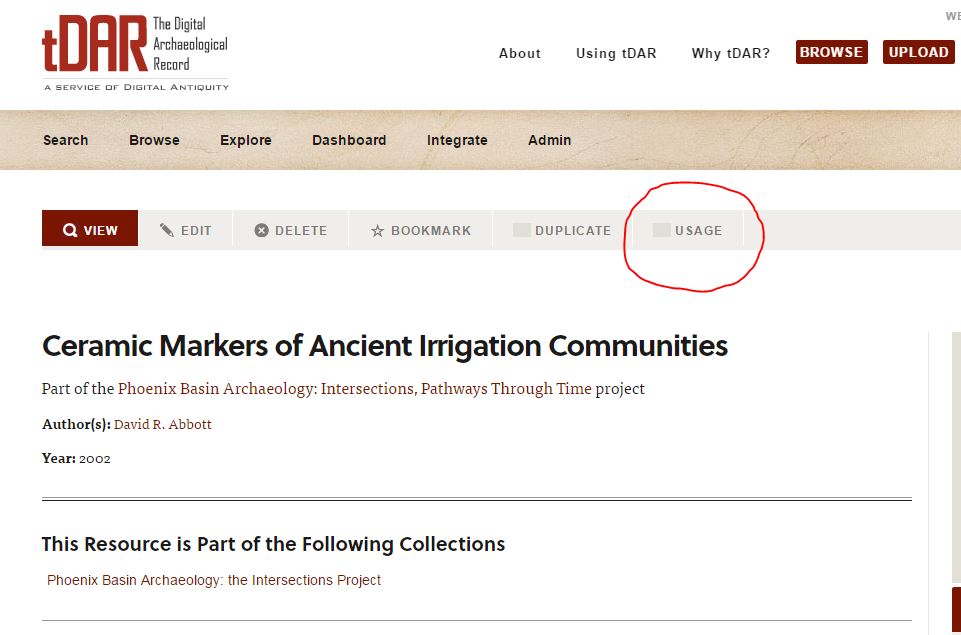
Navigate to a resource of yours that you would like to see stats for (you can view an individual resource as well as a collection or project).
Click on “usage” on the secondary menu bar.
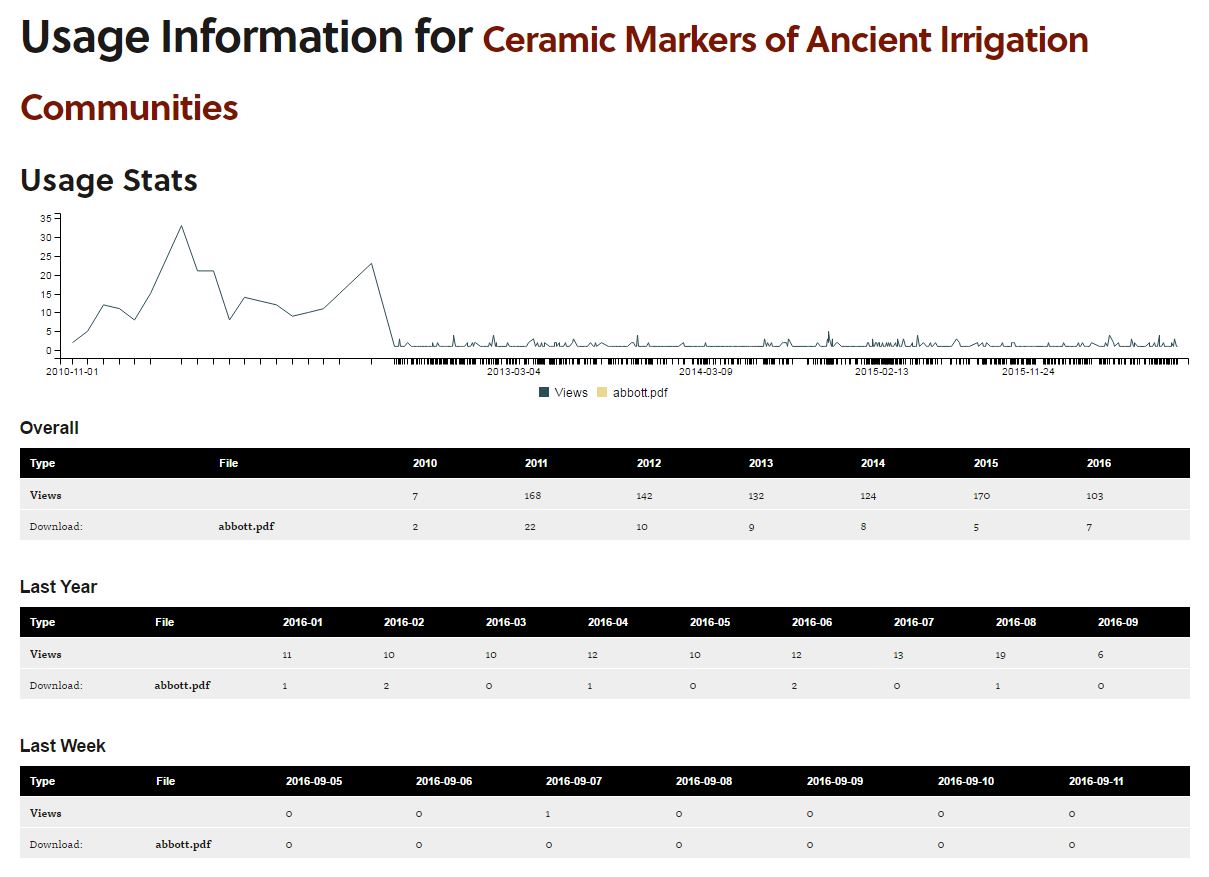
For individual resources you will see a line graph displaying views and downloads for the resource’s history. Views and downloads will also be broken down by year.
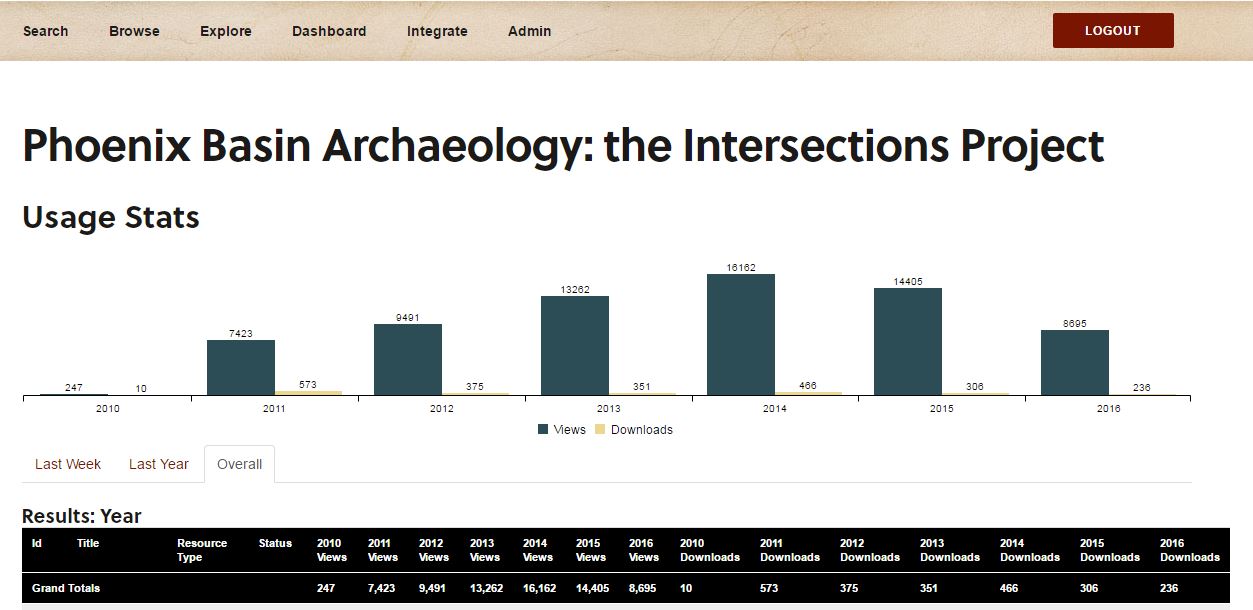
For collections, usage stats show information for views and downloads by year for the entire group of resources as well as for individual resources in the collection.
Sometimes you might add a file to tDAR and discover later that you need to replace it. Maybe you found a better scanned version of the document, or maybe you added new data to a data set. In any case, replacing a file in tDAR is easy, and as long as your new file doesn’t exceed file size range of the previous file there is no charge[1].
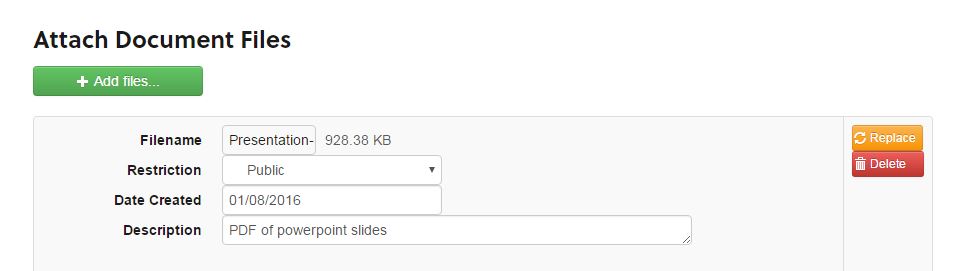
First, you will need to log in to tDAR and navigate to your resource. Select “edit” from the secondary menu bar at the top of the page, and scroll down to the section underneath the heading “attach document files.” You will see the current filename, and an orange button to the right of it that says “replace.” You will be prompted to select the file. Don’t forget to push the blue save button at the bottom or top of the metadata page. Your new file has replaced your old file! As a record owner you will also be able to see the history of changes to your file under file information on bottom of the resource metadata page.
[1] Remember that tDAR files are sold in 10MB increments, so if your original file is 3.3MB and your new file is 9.2MB there will be no charge. However, if your original file is 3.3MB and your new file is 11.6MB you’ll need to pay for an additional file.
Even though the weather is still sizzling and it feels like summer will never end, school is back in session here at ASU this week. It seems like a great time to remind you that tDAR is a fantastic resource for teachers and students alike. Educators at all levels can search tDAR for photographs and maps to enhance lectures. We have hundreds of real data sets that can be used in classroom exercises. There are even some sample assignments (another) in tDAR, and we would love to see more. Are you an educator who has made use of tDAR in your classroom presentations or assignments? Please tell us about it in the comments below!
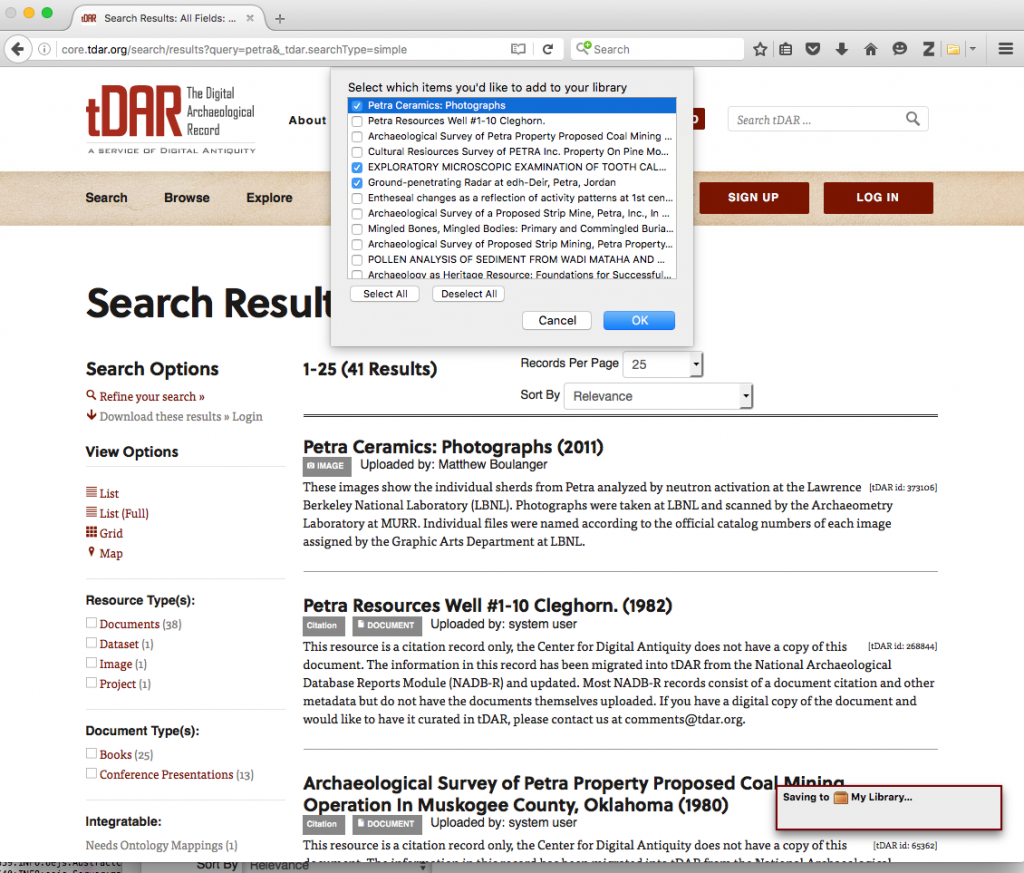
A search in tDAR is likely to reveal a large number of resources that you plan to explore as part of your research. Did you know you can download your search results as an Excel file? It is easy! After you have performed your search, simply click on the “Download these results -> to Excel” link on the left-hand column of the page[1]. Your search results will begin to download immediately. Use this to create a bibliography or update your bibliographic software (e.g. Endnote). If you use Zotero to manage your research sources you can easily use the browser-integrated save to select citations from your search results to save in your Zotero library.
[1] You must be logged in to tDAR to download your search results
This post was written by guest author: Sarah Neusius, Department of Anthropology, Indiana University of Pennsylvania (IUP)
My main project this summer is working with other zooarchaeologists who are part of the Eastern Archaic Faunal Working Group (EAFWG). With funding from the National Science Foundation (BCS1430754), we are preserving and integrating more than 50 Archaic Period (ca. 10,000 – 3,000 BP) faunal datasets and associated documents in tDAR (the Digital Archaeological Record).
Once the EAFWG has completed the uploading of the dataset files and created the metadata for them, these datasets will be publicly accessible for students and other researchers in the EAFWG collection within tDAR. These datasets were generated over the last sixty or more years by archaeologists working on sites located in the interior parts of Eastern North America. Because of a strong interest among archaeologists in human-environment interactions during the Archaic period the recovery and analysis of animal bones and other remains is a standard excavation procedure. This tradition of emphasizing zooarchaeological analysis continues today among Midwestern and Southeastern archaeologists interested in all of the PreColumbian periods. Good preservation has meant that large amounts of animal bone as well as mussel and snail shell often are recovered and significant faunal datasets have been generated for this region. Some of the better known of these sites are emblematic of the Eastern Archaic including Modoc Rock Shelter and the Koster site in Illinois, the Green River shell middens, such as Carlston Annis in Kentucky, and Dust Cave in Northern Alabama, but there are many other Archaic sites as well. Some of these datasets were recorded exclusively on paper, and some of the earliest digital faunal datasets were also created as a result of these excavations. Moreover archaeologists in this region continue to generate significant faunal data today. Unfortunately, these data have remained dispersed across a wide variety of institutions and are inaccessible to the larger archaeological community because they were recorded in a variety of formats and curated by individual researchers, some of whom are now deceased or no longer actively involved in Archaic period scholarship.
The EAFWG includes zooarchaeologists from IUP, the Illinois State Museum, the University of Kentucky, Florida State University, the Illinois Archaeological Survey, State University of New York at Oneonta and the University of Michigan at Flint. Besides meeting at professional conferences and staying in touch through email and conference calls, we have held formal workshops related to the project.
Our goal is to use tDAR to make accessible, as well as to preserve, significant Archaic period faunal datasets. Specifically, we want to spur comparative studies between and among the datasets from different sites in order to enhance and expand research into the Archaic period in Eastern North America. Traditional explanations for Archaic period variability and change have regarded environment and demography as causal. Unsurprisingly, such explanations are questioned by contemporary researchers, who argue that cultural identities, sociopolitical interactions, and ritual practices also explain some Archaic phenomena. In essence today’s archaeologists seek to understand Archaic period hunter-gatherers as more than participants in the ecosystem, and this raises new questions about the way Archaic data has been interpreted over the last half century or more. We think zooarchaeological data has much to contribute to these debates. Ultimately we have some macrolevel questions about the variable use of aquatic resources by people who lived in this area during the Archaic period, which we believe will contribute meaningfully to better understanding of the Archaic period. Work on these topics by members of the EAFWG continues.
Over the past year and through this summer I have been involved with myriad details, most of which would be far too boring for a blog such as this. However, I hope you can see why there are many steps in the EAFWG project. These have been accomplished with the help of several IUP undergraduate students and graduate students, and have included: (1) creating digital databases from paper records in the first place; (2) finding and removing errors from digital datasets; (3) uploading digital datasets to tDAR; (4) providing metadata about what is in each dataset and what variables it contains; and, (5) creating the means of comparing datasets using tDAR ontologies.
We are exploring how comparable our Archaic datasets are in terms of taphonomy and contexts sampled, and working on measuring environmental and demographic variation during the Archaic period. By the end of the summer, we hope to begin to consider our research questions concerning the use of aquatic animals more directly.
For me personally, this summer project has provided few chances to be outside as much as I would prefer or to develop the muscles and fieldwork tan that I often do. Regardless, the Archaic period was my first love in North American Archaeology. This project is an opportunity to revisit my dissertation research on the Koster site, which is pretty enjoyable and exciting for me. Both collaboration with other zooarchaeologists, and looking at data I know well with new perspectives is a lot of fun. So if you encounter me this summer and find me slightly glassy eyed from staring at the computer screen, rest assured that I’m still absorbed in archaeology!
Welcome to Obsidian: The Center for Digital Antiquity’s 15th major release of tDAR. In this overview of Obsidian you will find information detailing both the major and minor improvements made to the tDAR system. The pertinent modifications of Obsidian include improvements to Collection and Keyword Pages, Maps, Data Integration, and a new export feature.
Improved Collection Pages:
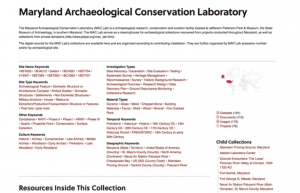
We have enhanced collection pages (example) to include more summary information about the collections’ contents. This includes a map showing where the resources in the collection are located geographically (aggregated from the bounding boxes) and clusters of common keywords related to the resources in each collection. Additionally, when viewed in the “map view”, collections now dynamically load all of the items in the collection onto the map.
Coding Sheet Mapping & Dataset Changes:
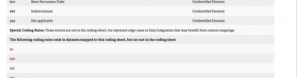
Coding sheets now have an error report displaying values that may be missing from them, but are present in the datasets they’re mapped to. They also include “special” mappings for values that are unknown, or missing.
Data Table Descriptions:
One of the missing features for data tables was a user’s inability to add a description to a dataset; we have corrected this issue.
Simplifying Associating Images with Datasets
With datasets like the Mimbres collection, we’ve added a new column type “filename” that simplifies the mapping between a row in a dataset and an image file.
Searching within maps:
With tDAR’s coverage being worldwide, one challenge is allowing a user to identify a specific area on the map to either search or draw their bounding box. We’ve added a search box in the top right of most maps to allow users to specify a town, city, state, or country to navigate on the map to the approximate location.
Improved World Map
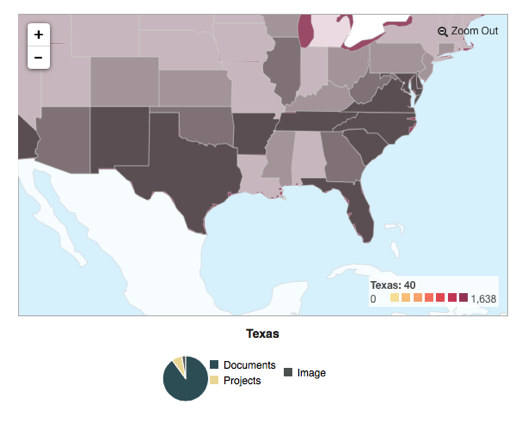
We’ve expanded the world map on the homepage to allow users to filter down to specific states within the US. Users can now see how many resources are associated with each US State as well as country. This has also been implemented in an extensible form that will allow us to implement similar maps on collection pages.
Faster searching:
We’ve removed some of the debugging associated with the initial SOLR implementation as well as improved how we display and manage information in SOLR to significantly impact the search performance (In some cases, up-to 10x faster). Of note here, we were extremely conservative in our initial implementation of SOLR, and this release, along with the next few will start to make more aggressive changes that take advantage of all of SOLR’s features as well as improvements.
Data Export:
It’s important for users to feel confident about contributing their data to tDAR. Part of fulfilling our promise of being an archive is allowing users retrieve their materials again. We’ve added the ability to export all of the files associated with a billing account or collection. Users can make a request and the system will create a ZIP file with all of the files they uploaded, any archival versions, and copies of the XML metadata records, providing a description of all records.
Linked Open Data:
We’ve added the ability to associate keywords with external vocabularies such as Open Context, Pelagios, and other authorities. Those keywords and relationships are exposed as JSON-LD and embedded in each tDAR page.
Improved API Documentation:
We’ve updated tDAR’s API documentation to include more info on what APIs are available, and how to access and/or use them. We’d love your feedback on their functionality and are more than happy to assist with any questions you have. We are always open to suggestions on what you think would assist in the continuous improvement of tDAR.
GeoJSON search endpoint:
Along with our existing search endpoints (HTML, and RSS / GeoRSS), we’ve added a GeoJSON endpoint for tDAR allowing easier display of tDAR results on ESRI, Google, and Leaflet maps.
We hope you enjoy the new features and improvements available in our Obsidian release. As always, we encourage you to be in touch with questions or feedback. If you would like to learn more about tDAR for your personal or professional research and data management needs contact us.
This post was written by guest author Kyle Bocinsky.
A database of 32,863 tree-ring dates from across the southwestern United States—the largest and most comprehensive of its kind to date—is now available through tDAR. To build the database, we started with a smaller database gathered by Mike Berry and the Dominguez Anthropological Research Group and added several thousand dates from archaeological projects across the Southwest. All dates were determined by the Laboratory of Tree-Ring Research (LTRR) at the University of Arizona. We also used the state site databases for the Four Corners states—Compass (Colorado), NMCRIS/ARMS (New Mexico), Utah Division of State History, and AZSITE (Arizona)—to assign site locations (UTMs) to each tree-ring date.
In an associated research publication—Exploration and exploitation in the macrohistory of the pre-Hispanic Pueblo Southwest (Bocinsky et al. 2016)—my colleagues Tim Kohler, Keith Kintigh, Johnathan Rush, and I analyzed these data for macroscalar patterns, and noted a four-peaked pattern in the number of tree-ring dates through time first established by Mike Berry in the 1980s. These four peaks correspond closely to the widely recognized Pecos classification of Ancestral Pueblo cultural phases. We then compared the tree-ring date distribution to a high-resolution reconstruction of the direct-precipitation maize farming niche across the Southwest from AD 500–1400. We argue that each of the Pecos periods initially incorporates an “exploration” phase, followed by a phase of “exploitation” of niches that are simultaneously ecological, cultural, and organizational. Exploitation phases characterized by demographic expansion and aggregation ended with climatically driven downturns in agricultural favorability, undermining important bases for social consensus. Exploration phases were times of socio-ecological niche discovery and development.
In the research paper, we only use the tree-ring dates from AD 500–1400 (29,311 dates), but we include the comprehensive database in tDAR. We’ve posted two versions of the database: one without site locations that is available to any registered tDAR user, and another available only to those who request permission from Tim Kohler or myself. The database contains site numbers and site names, lab (LTRR) numbers, references where available, the outer date (AD), the outer symbol, and the confidence level. To obtain access to the confidential version with site locations, you must demonstrate that you have permission from the managers of the statewide site files in the four states: Compass (Colorado), NMCRIS/ARMS (New Mexico), Utah Division of State History, and AZSITE (Arizona).
We hope that people find this database useful, and we intend for it to be expanded in the future!
REFERENCES
Bocinsky, R. Kyle, Johnathan Rush, Keith W. Kintigh, Timothy A. Kohler, Exploration and exploitation in the macrohistory of the pre-Hispanic Pueblo Southwest, Science Advances2, e1501532 (2016).
Berry, Michael S., Time, Space, and Transition in Anasazi Prehistory (University of Utah Press, Salt Lake City, Utah, 1982).
Once again Digital Antiquity has partnered with The Society for American Archaeology to preserve the meeting abstracts and make the presentations and data used to support them available in tDAR. As a presenter you can access your record in tDAR, edit the metadata, and upload a PDF copy of your paper, presentation, poster, or other supplementary data (up to 3 files/30MB). The project is now live in tDAR! Here’s how to get started:
Search for your abstract.
Request access (will require a free registration).
Once completed, we will send you a message with a link to edit the abstract and upload the record.
Scroll down and edit or enhance any of the metdata you would like. Click on the green "add files" button under "Attach Document Files" and follow the prompt to upload a PDF copy of your paper or poster. If you'd like to upload a dataset in addition to your paper or presentation, please contact us for a voucher. If you are adding multiple files (e.g. your paper, a copy of your presentation, and a dataset) you will probably want to create a project.
You may save your work at any point along the way, but when your edits are complete, make sure to change your resource's status from "draft" to "active".
Click save and you are done!
As always, please call or email Leigh Anne at (480) 965-1593 or laellison@digitalantiquity.org with any questions along the way!
Were you a presenter in 2015 (San Francisco) but haven't uploaded your presentation yet? Not to worry--those abstracts are also in tDAR and can be found in the search bar at the top of this page too. Help other researchers find and cite your SAA presentations by making them available today!
And SAA Student Members don't forget that you are eligible to upload 3 files to tDAR annually as part of your membership benefits! Email membership@saa.org to receive your voucher.
 EXARC, the ICOM Affiliated Organisation representing archaeological open-air museums, experimental archaeology, ancient technology, and interpretation, migrated it’s bibliographic database into the EXARC Experimental Archaeology Data Collection in tDAR this month, with technical support from the Center for Digital Antiquity. Now, in addition to providing an extensive bibliography for those interested in experimental and experiential archaeology, primitive technology and archaeological open-air museums, EXARC will be able to make publications and supplementary data (images, fieldnotes, large datasets) available, where possible; and preserve the files for the long-term. It will also make the bibliographic citations available to a wider audience by including them with other archaeological resources.